

We collected data from the Meavy Way substation which supplies electricity to St. Peter’s Junior School and approx. 130 homes in the Greenlands area of Tavistock. These are supplied through three separate feeders which we have called Green Lane (for properties closest to Green Lane), Deer Park (for properties closest to Deer Park) and 114-124 (Tamar Avenue).
The data available includes Total Power used, its Carbon Intensity and Voltage.
You can view a selection of this data from this page. Click on the pictures in the gallery below to see each graph displayed. You can use the buttons below the graph to change the days.
Please let us know if you have any views or comments. Email hello@tamarenergycommunity.com
 Total Power used at substation |
 Total Power used at substation by feeder |
|
 Total Power and Carbon Intensity in bar chart format Total Power and Carbon Intensity in bar chart format |
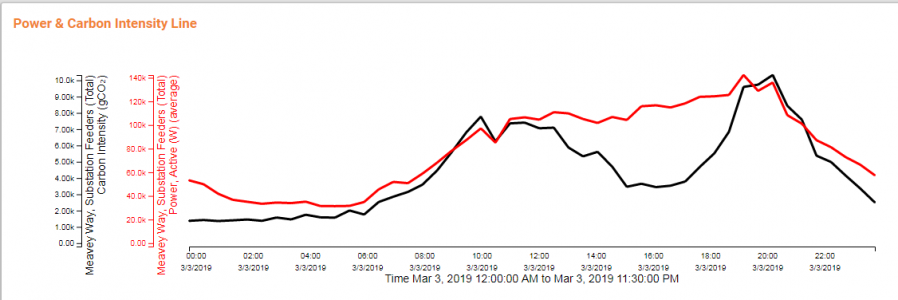 Total Power and Carbon Intensity in line format Total Power and Carbon Intensity in line format |
|

Total Carbon Intensity Smiley |
![]()
We’re developing a web based application, which you could also access on a tablet, smart phone or your computer. This will display Total Power used in a similar format to an In House Display (IHD) (which you get when you have a smart meter).
This is an early example and the only inter-active bits that are working at the moment are the arrow buttons. If you have any comments or feedback please let us know: openlv@tamarenergycommunity.com.
If you’re interested in playing with data, developing apps etc., and would like to get involved, we’d love to here from you.
You can access the app here or by clicking the TEC App icon
The first one shows the power used across the Meavy Way LV substation by each of the three ‘feeders’ (each substation has a number of ‘feeds’ to the different properties. Meavy Way has three feeders). The second one shows the total power used by everyone connected to the Meavy Way substation.